![](https://cdn.myportfolio.com/919bfea4ae9a31a82f4e17f0cd23775c/b0e1806d-8489-4a0c-a08c-669eb762b2fb_rw_1920.jpg?h=c941b5215f0a3797df793bbcb0e37ae1)
![](https://cdn.myportfolio.com/919bfea4ae9a31a82f4e17f0cd23775c/8b6ff300-5d99-47af-9c23-1a74e2b79f97_rw_1920.jpg?h=ad479f3dc24fc2c7a5e0192a77b99cd8)
![](https://cdn.myportfolio.com/919bfea4ae9a31a82f4e17f0cd23775c/2e50c722-7ccf-407c-9736-437aa4e54967_rw_1920.jpg?h=af292650bf3eba777312c5f74122cfb1)
![](https://cdn.myportfolio.com/919bfea4ae9a31a82f4e17f0cd23775c/5c8e7e6c-94f4-4cde-bd3b-1c8c6a8ceb17_rw_1920.jpg?h=9ac5f3fe1c2e74d282f9c3c55d45bcf4)
![](https://cdn.myportfolio.com/919bfea4ae9a31a82f4e17f0cd23775c/7e9901f9-b406-4ee9-8928-3de41e0251d9_rw_1920.jpg?h=3c115111961bdf4e37cc1fc9ee7be322)
![](https://cdn.myportfolio.com/919bfea4ae9a31a82f4e17f0cd23775c/6503edc6-6e33-4d01-b6d9-cda09b71d7d5_rw_1920.jpg?h=7b31016a0c265c37956f87a5d169d592)
![](https://cdn.myportfolio.com/919bfea4ae9a31a82f4e17f0cd23775c/8a72f223-3cbd-47de-b1d7-0d947cc039e9_rw_3840.jpg?h=e094eb0d1c60a0378f93db6e5e687d4d)
![](https://cdn.myportfolio.com/919bfea4ae9a31a82f4e17f0cd23775c/5cd90c1a-8906-483a-a03d-1fe17bf73039_rw_3840.jpg?h=f5e19ffe70e413833cb1ccdaed7d8e77)
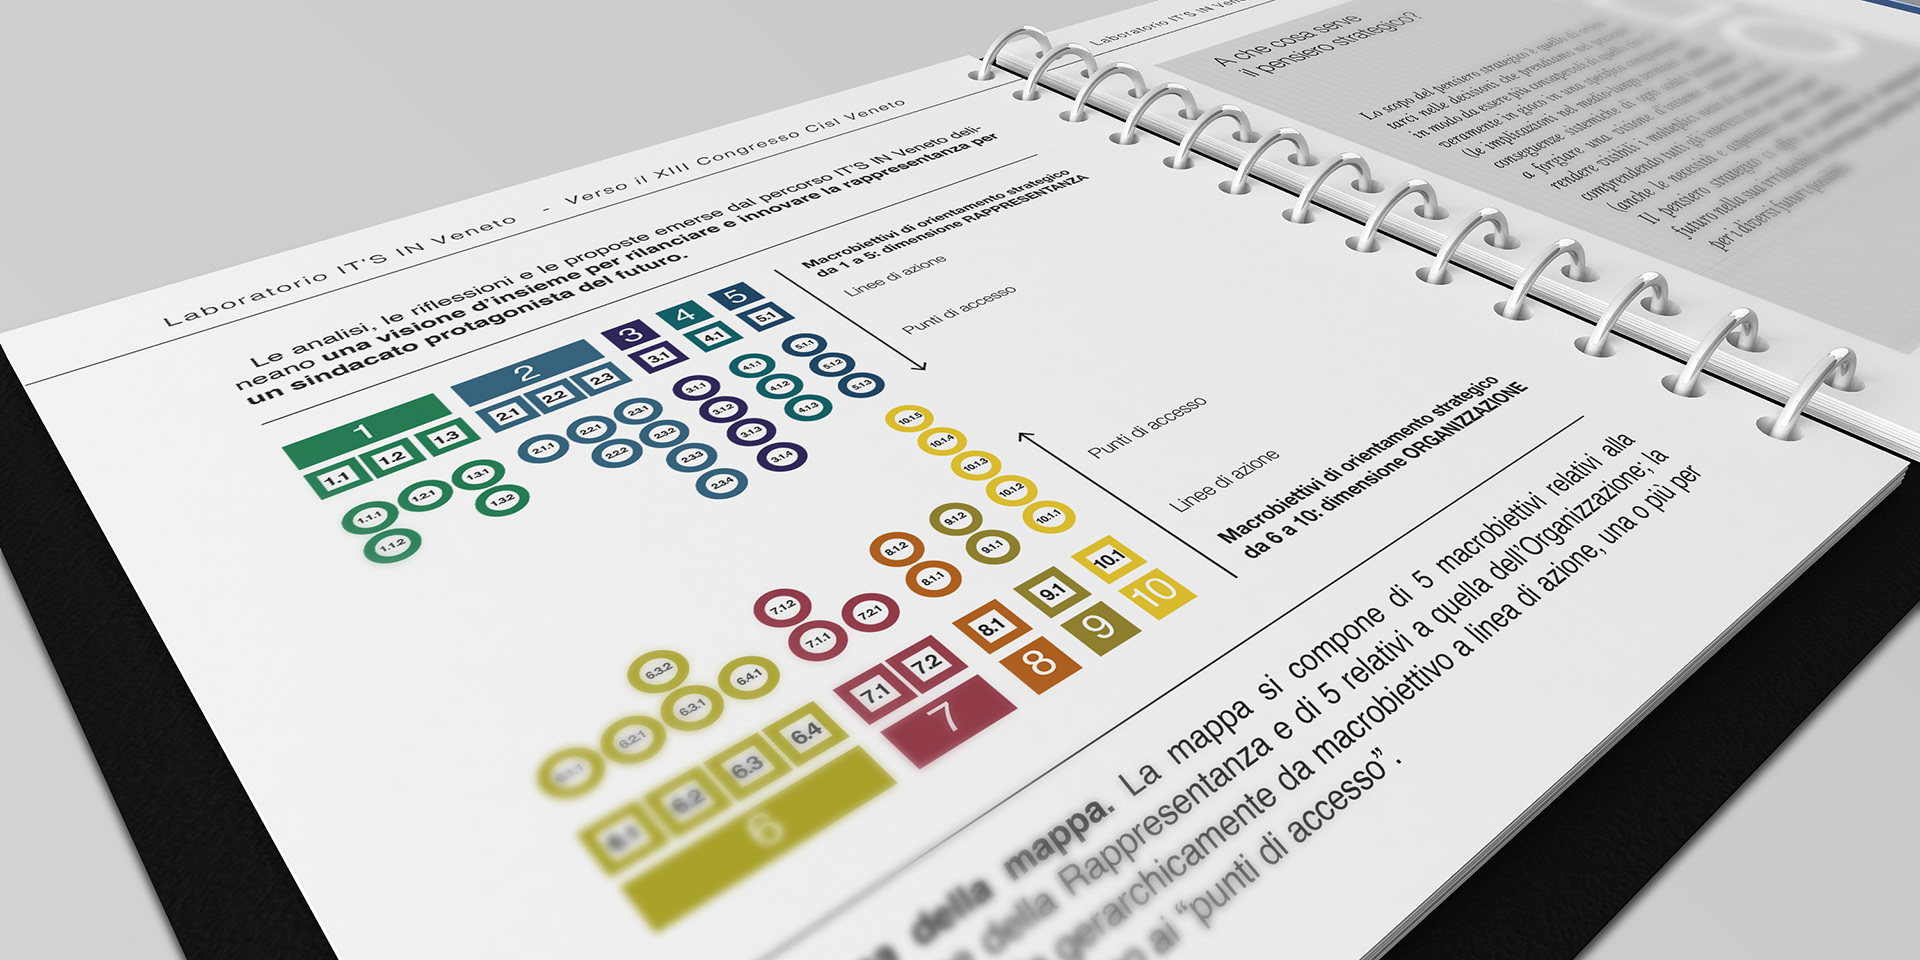
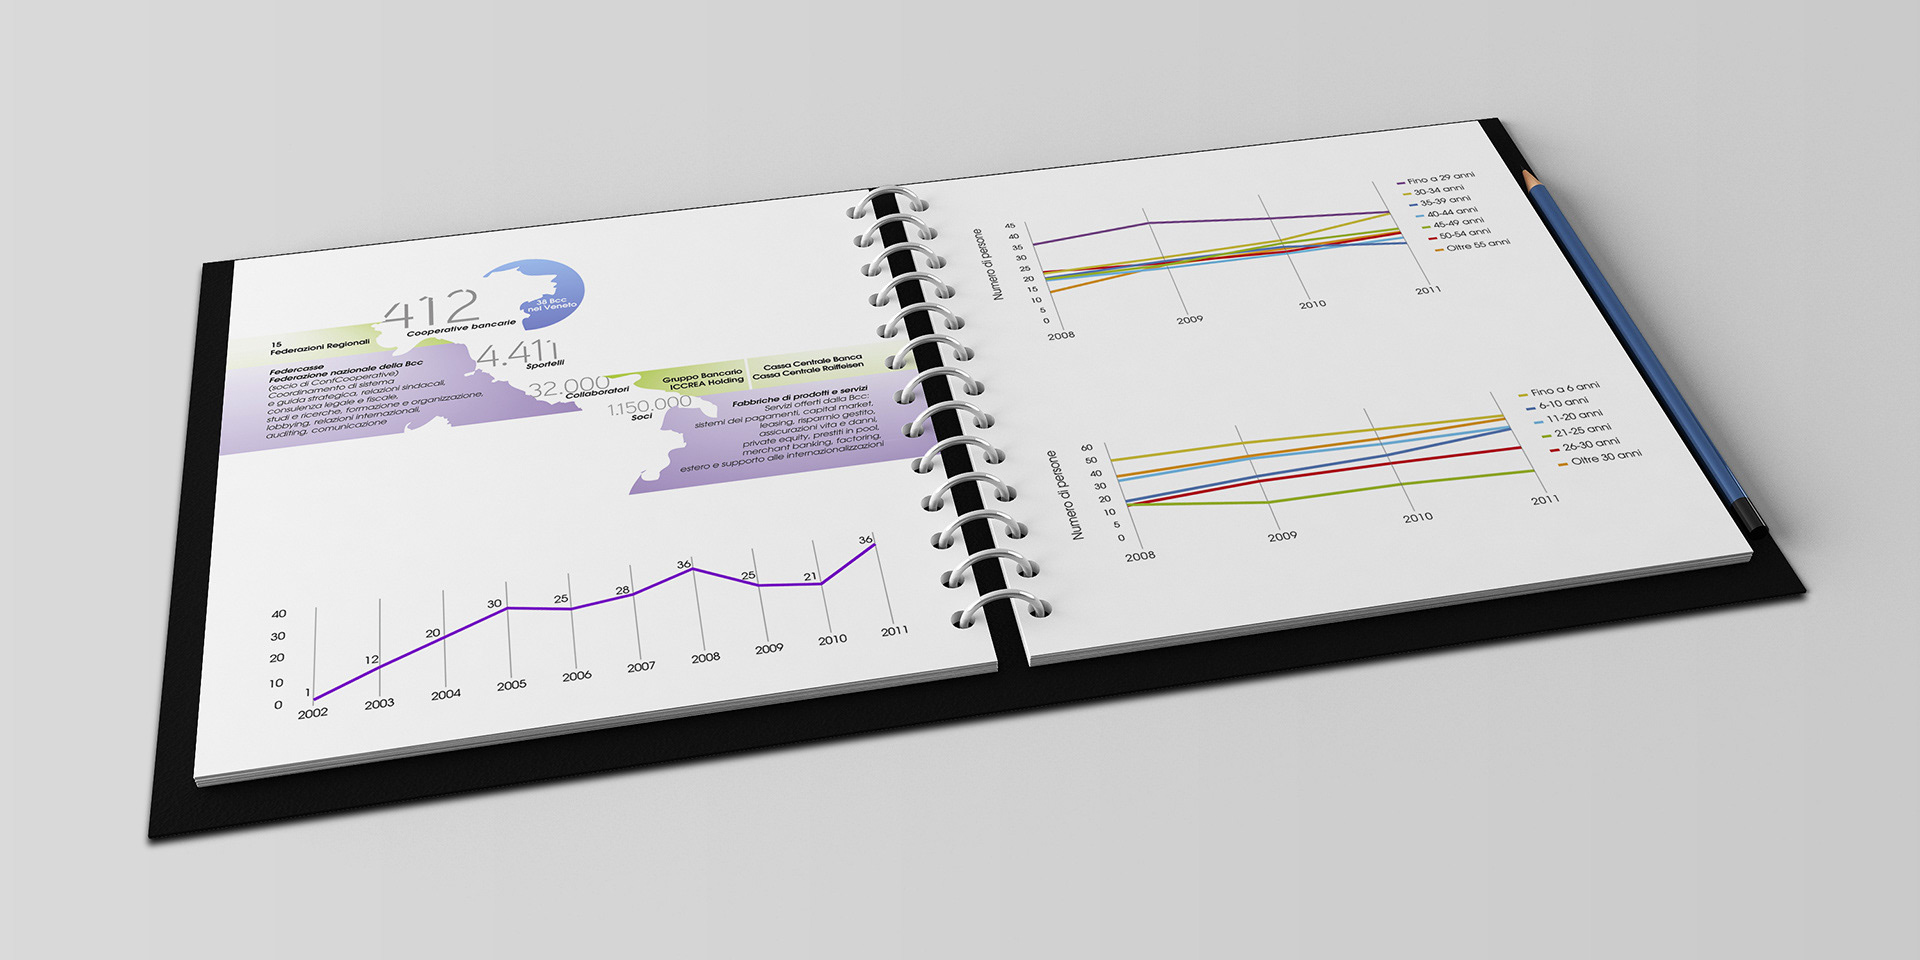
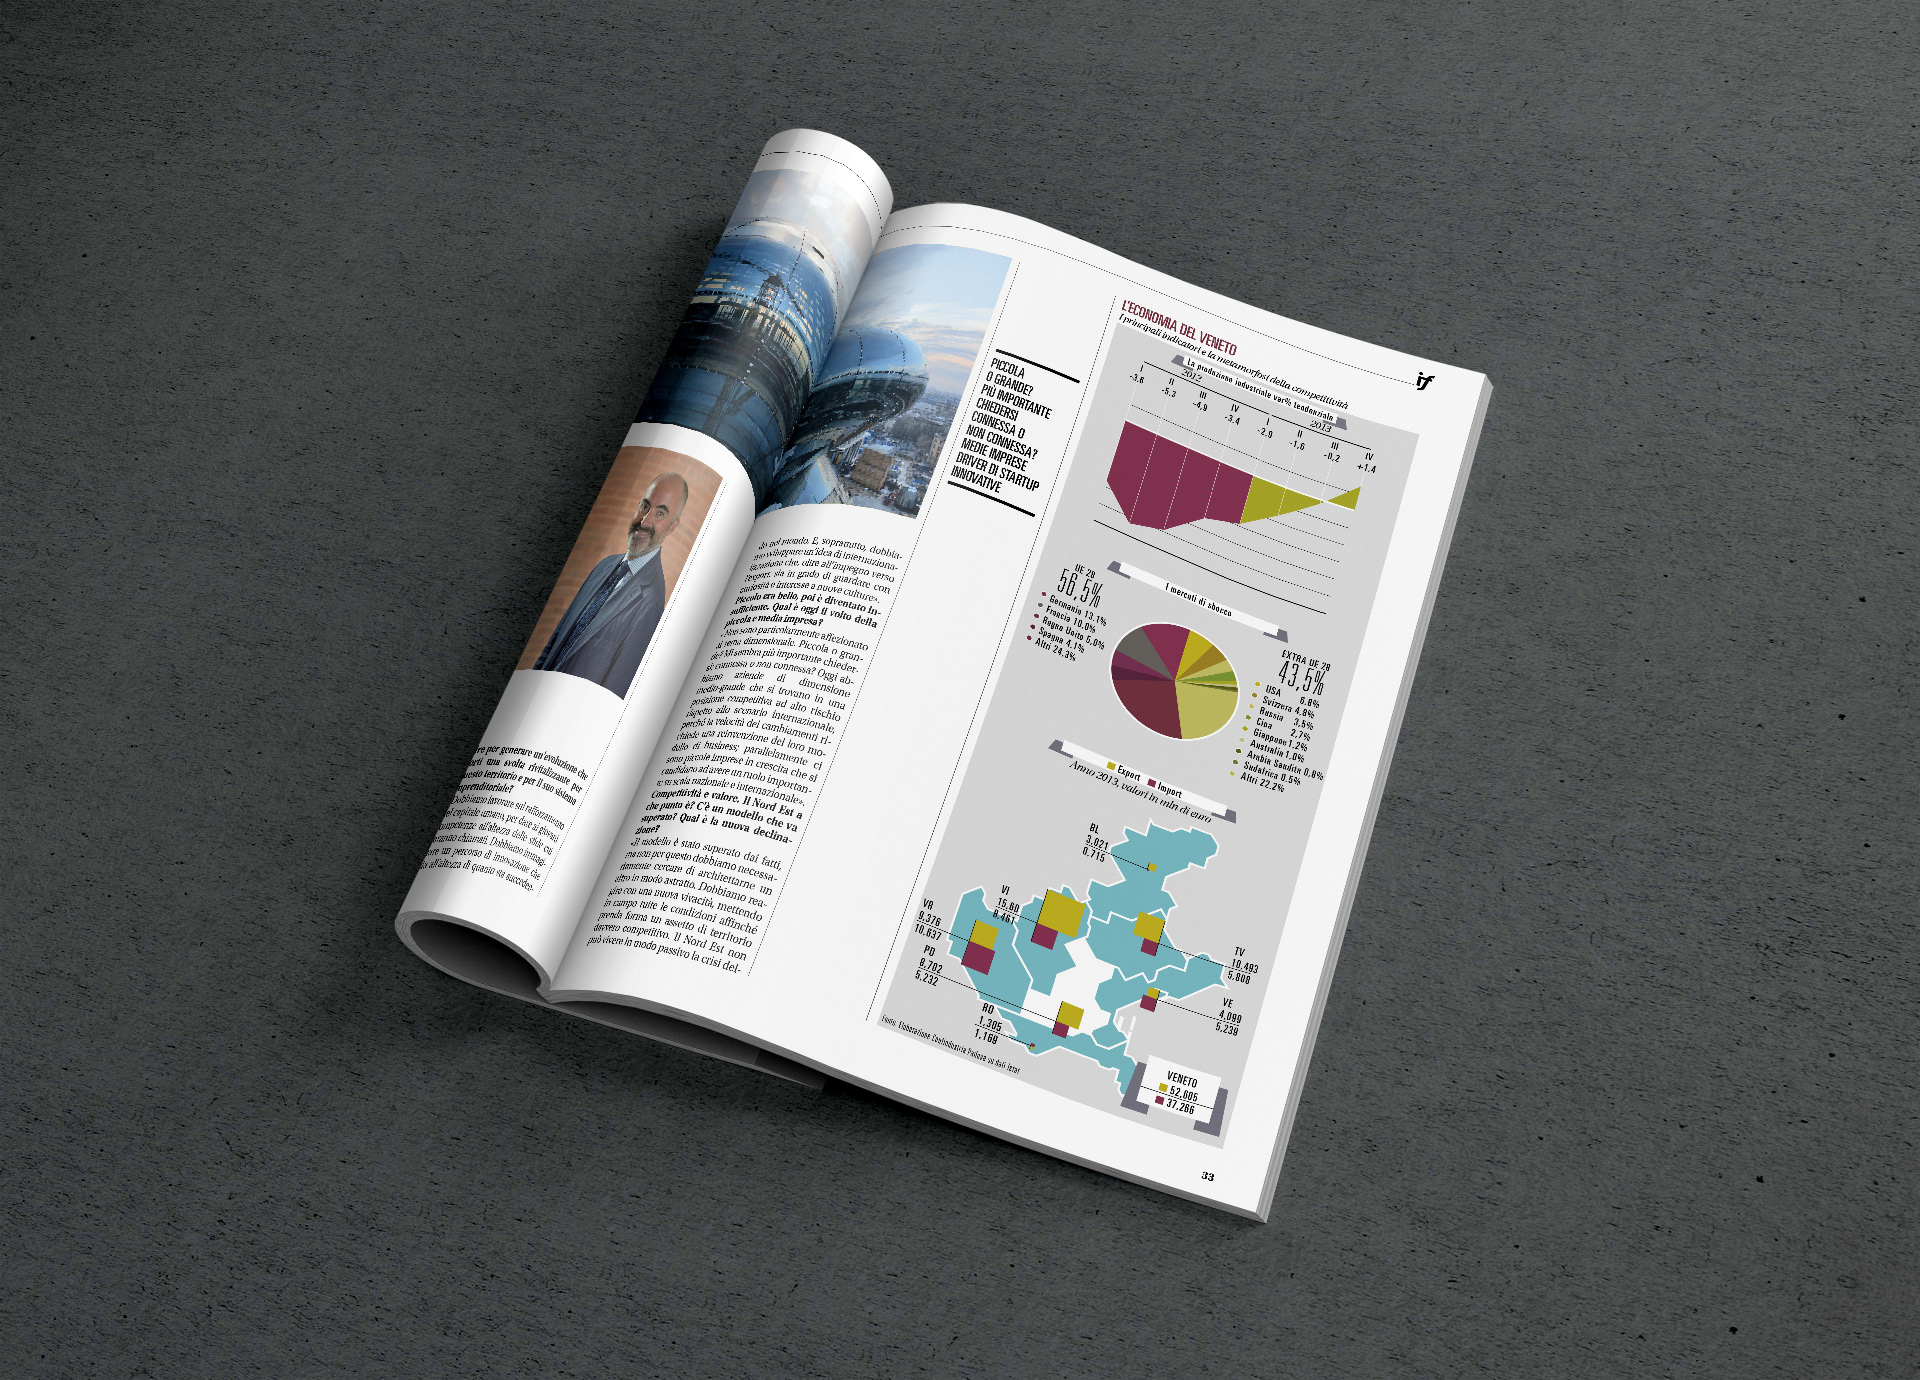
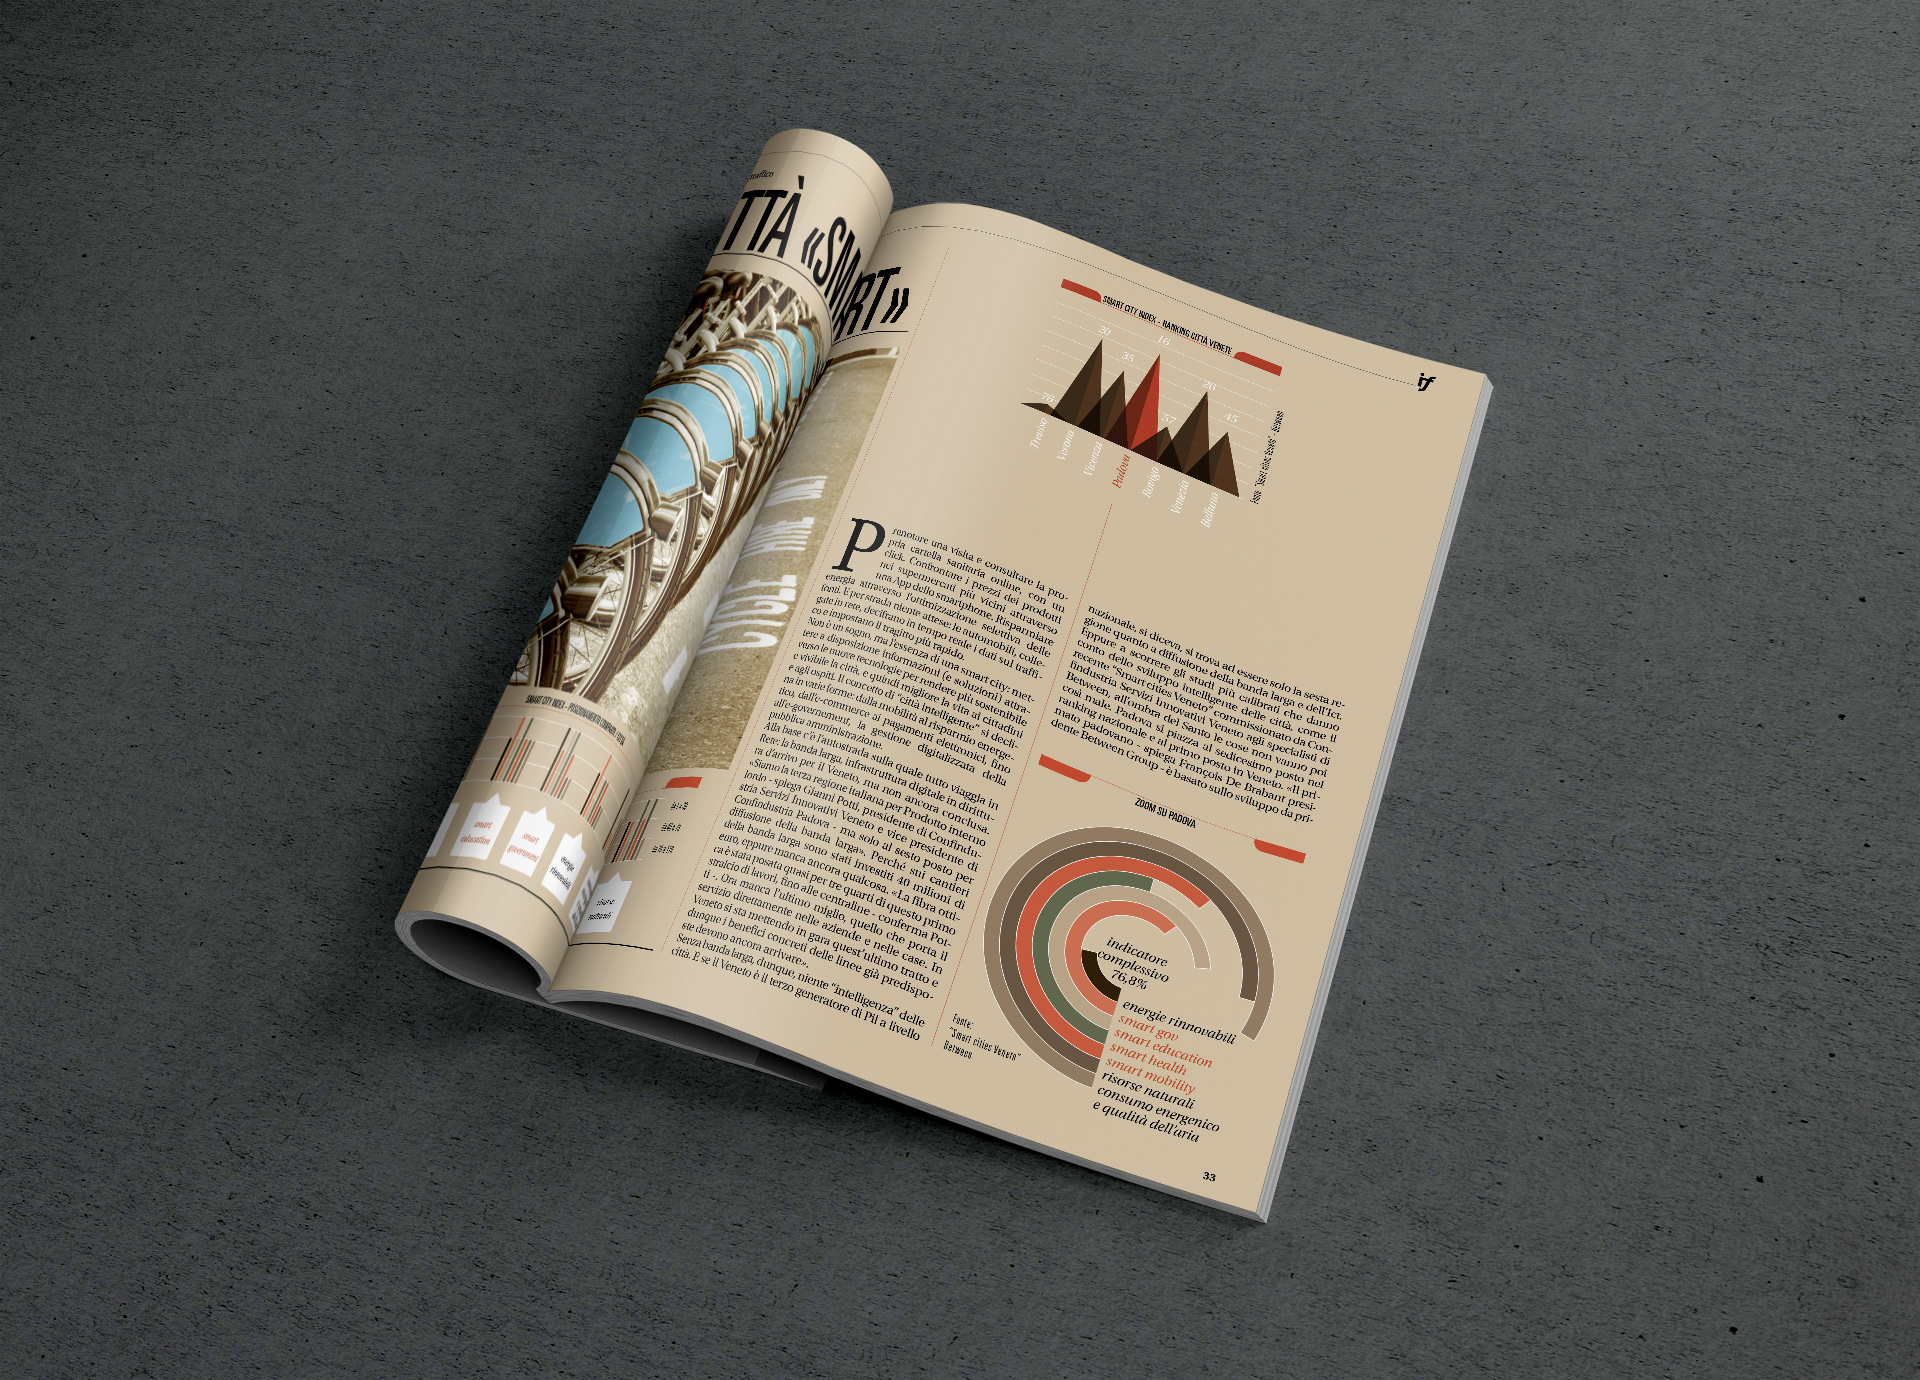
Una sintesi grafica di concetti, oppure un trend, oppure correlazioni o confronti. Ho sempre pensato che Infografiche, mappe, data visualisation avessero un compito: far leggere senza leggere, dare un'occhiata a un discorso, magari per incuriosire. Ottimo strumento per l'editoria e oggi molto diffuso sui social, grazie anche alla mole di dati che si hanno a disposizione.